Project information
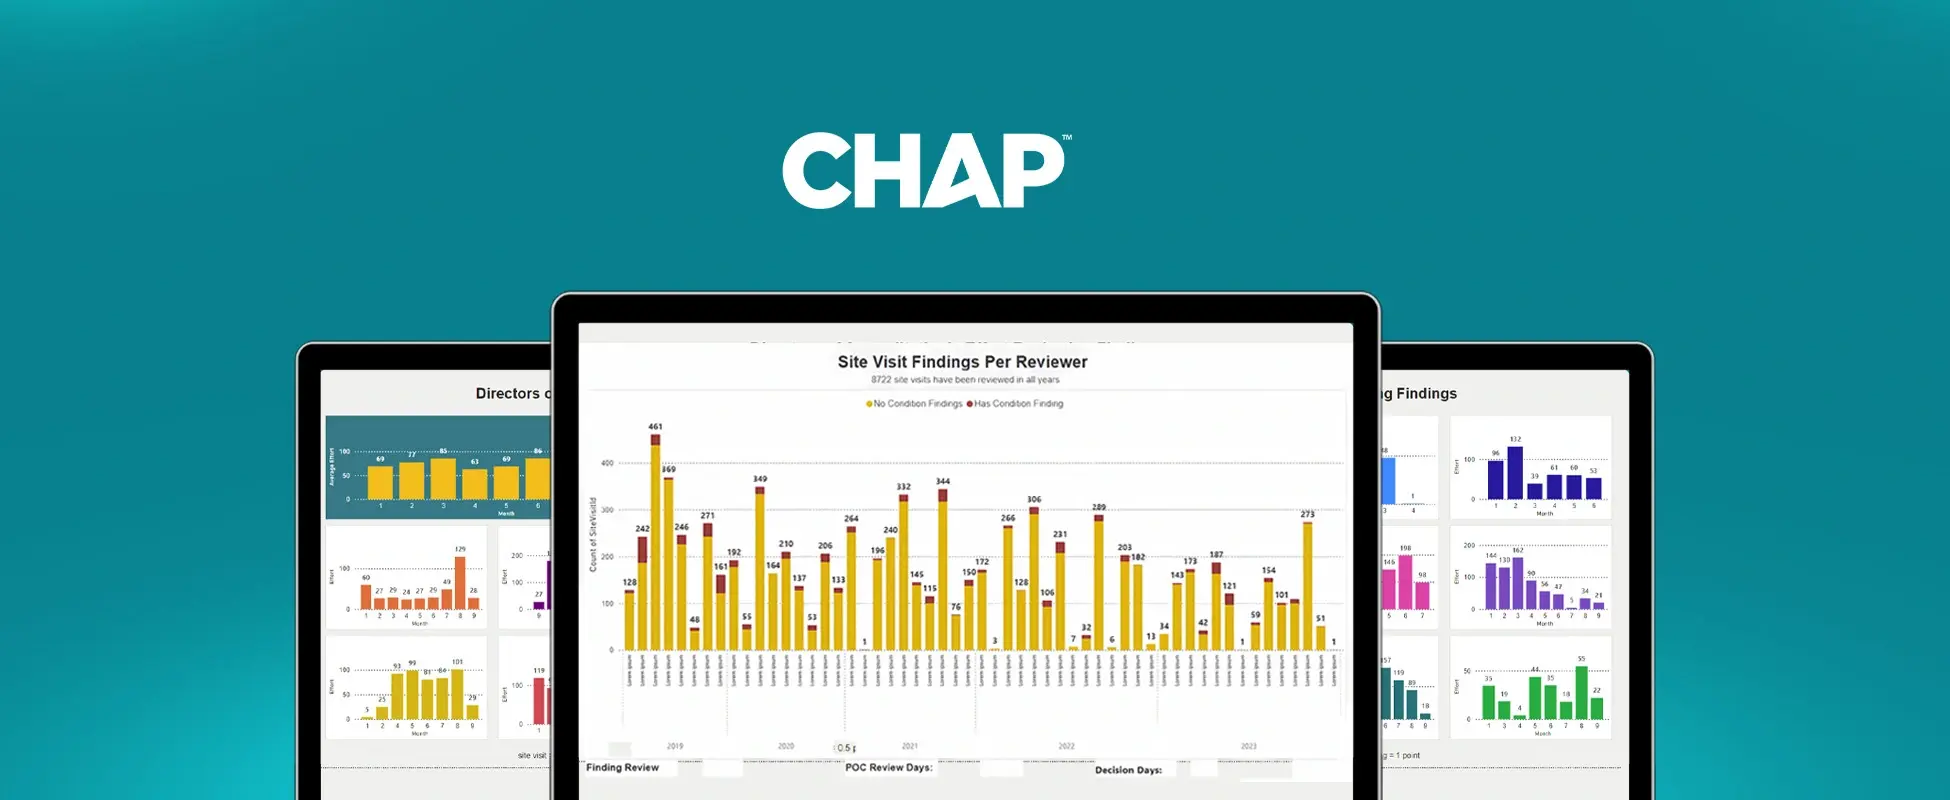
Power BI Dashboards
CHAP’s Power BI platform required improvements in data accuracy, styling, and functionality. We enhanced their dashboards by writing SQL queries to pull and manipulate data from their data warehouse, syncing daily updates, fixing existing dashboards, and creating new ones. These tailored dashboards now provide actionable insights into survey progress, employee performance, complaints, and user activity, empowering CHAP to make informed decisions and improve operational efficiency.
Features:
- Data Extraction and Manipulation:
- Developed SQL queries to extract and manipulate data from CHAP’s data warehouse for accurate and up-to-date dashboard reporting.
- Ensured daily synchronization of data to maintain dashboard reliability.
- Enhanced Dashboards:
- Fixed existing dashboards to improve usability, styling, and data visualization accuracy.
- Built new dashboards tailored to specific business needs, including:
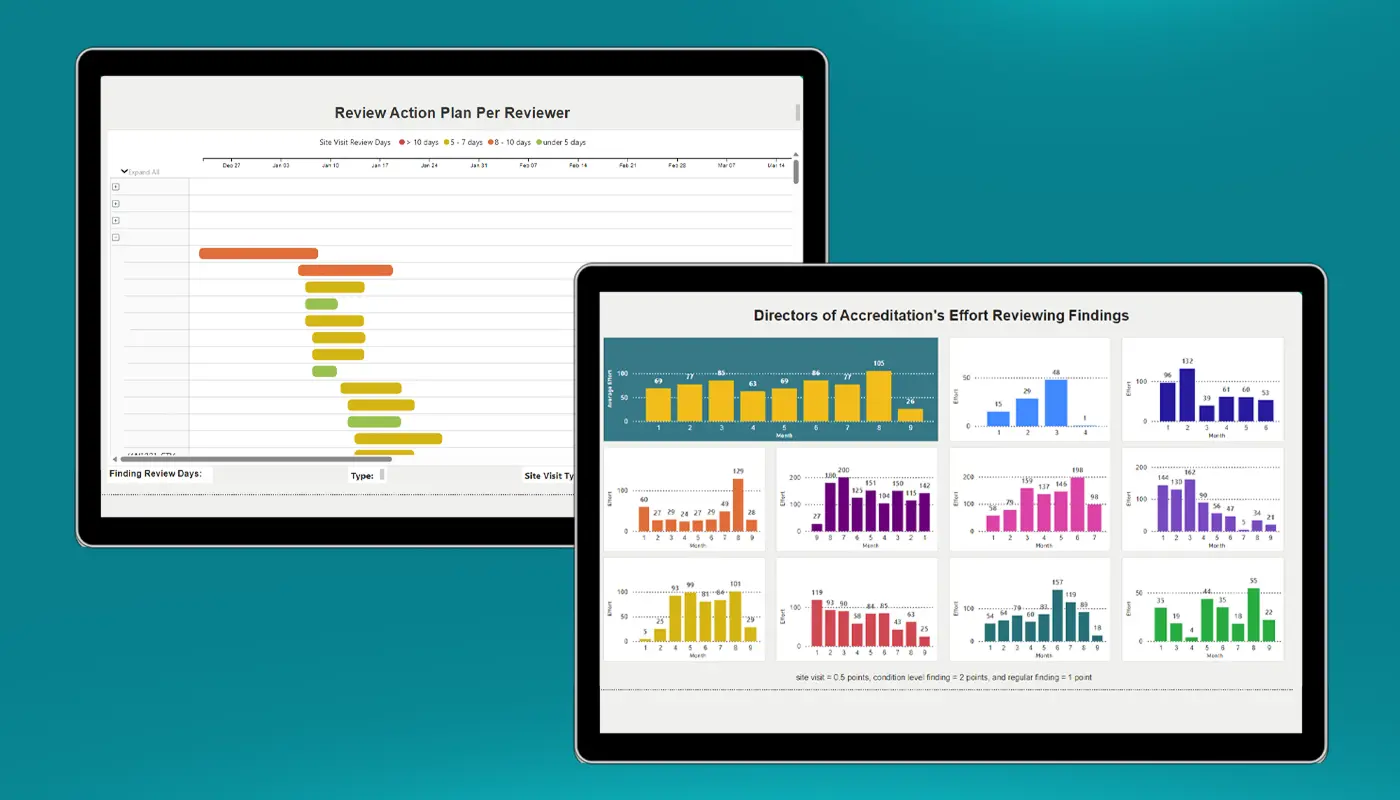
- Director of Accreditation Dashboard: Tracks surveys from start to finish, reviews findings, calculates employee performance, and monitors survey progress.
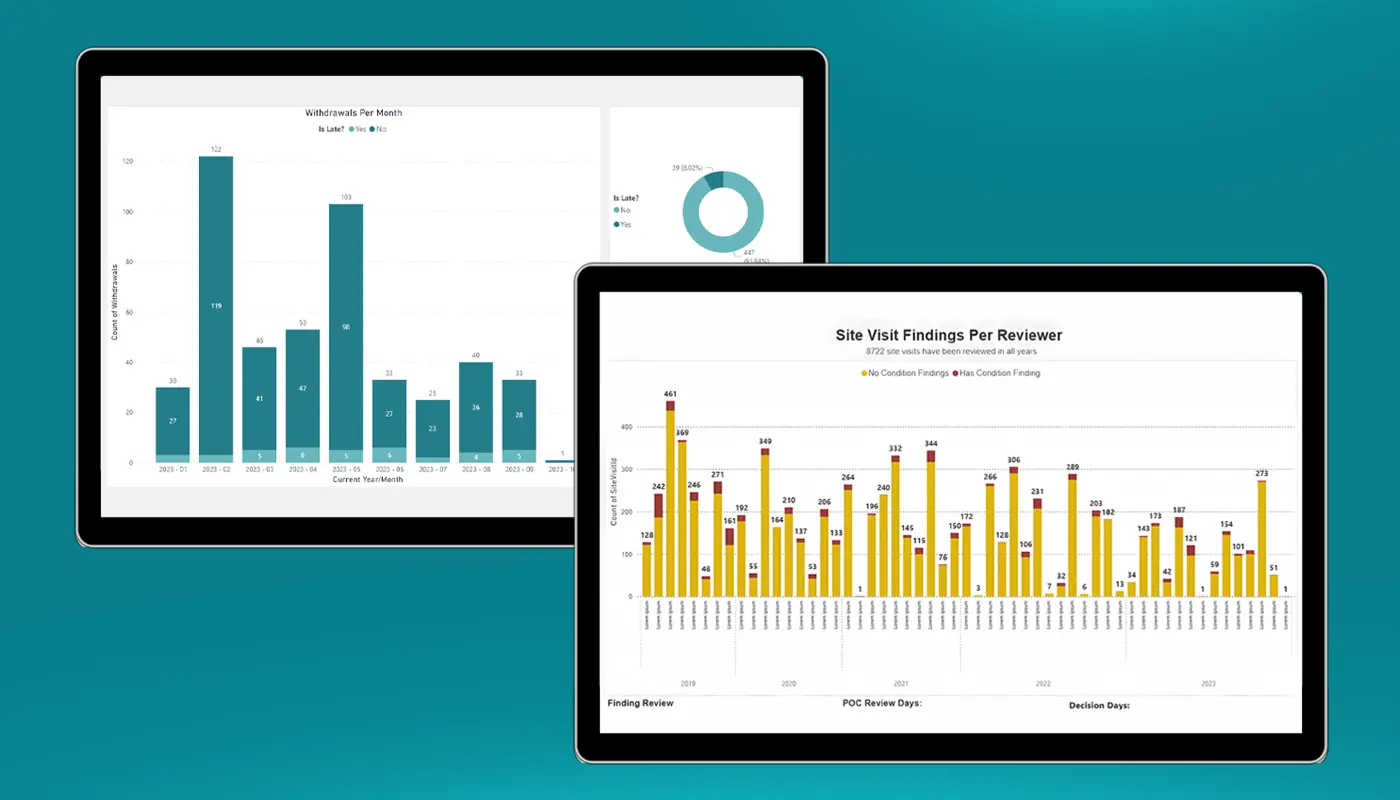
- Withdrawal and Termination Dashboard: Displays reasons, location service lines, and historical comparisons by month and year.
- Initial Surveys Dashboard: Shows surveys seeking deeming, granted accreditation, and filters data by findings, decisions (deferred/denied), and year.
- Complaint Dashboard: Categorizes complaints by service line, source, results of investigations, deficiencies, and site visits.
- User Activity Dashboard: Tracks logins, user activities over a range of time, and filters by frequency (e.g., 0–90 days, 121–210 days).
- Advanced Analytics:
- Implemented historical data comparisons for trends, year-over-year growth, and monthly insights.
- Improved filtering and categorization options for better data segmentation.
-
Client CHAP
-
Start Date 01/03/2023
-
Service required Data-Driven Insights & Predictive Analytics


 Physical: